
Fiduciary Management Q4 2025 Investment Strategy Outlook

Galeanu Mihai/iStock via Getty Images
The intoxication with Artificial Intelligence (AI) related companies continued in 2025, in conjunction with a low-quality “junk” rally that added fuel to the fire. Investors who were willing to extend out along the risk curve were rewarded. The Russell 2000 (RUT), S&P 500 (SP500), Msci Eafe (Local/USD), and MSCI World (MSCI WORLD) gained 12.81%, 17.88%, 20.60%/31.22%, and 21.09%, respectively. Many Wall Street strategists are now penciling in greater than 10% returns for the S&P 500 again in 2026, which would mark four consecutive years of double-digit returns for only the third time in history. It last occurred in the lead-up to the dot-com crash in the late 1990s, with an earlier iteration in the post-war period (1949-52). In the current cycle, record U.S. valuations have failed to put a damper on speculative behavior. Quite the opposite, in fact.
Each of FMI’s portfolios have generated solid double-digit annual returns over the past 3 years, but as expected, have not kept pace with the broader indices given the backdrop. While FMI’s discipline on business quality, balance sheet strength, and valuation have served our clients well over our 45+ year history, these investment attributes have been shunned in the current climate. We underwrite calculated risks and remain true to our process. As the stock market exhibits increasing signs of a potential bubble, we continue to proceed with restraint and prudence.
Junkyard Rally
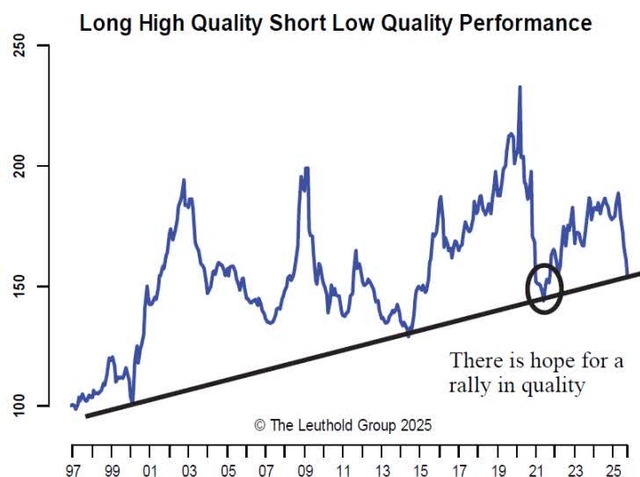
Equity market index providers such as S&P, Russell, and MSCI each define “quality” businesses a bit differently. A variety of factors are used for classification, including return on equity (ROE), profitability, balance sheet leverage, earnings variability, and cash flow (i.e., accruals ratio). These are generally consistent with how FMI defines quality: businesses with sustainable competitive advantages and barriers to entry, return on invested capital (ROIC) above cost of capital, strong earnings quality (cash flow generation) and predictability, and a robust balance sheet. As illustrated in the chart on the top, high-quality has underperformed low-quality sharply in the U.S. in 2025 (per the downward sloping blue line), despite outperforming over the long run.
Low-quality’s recent outperformance has been especially acute in the small cap universe, where companies that lose money, have a low ROE, do not have sales, or are high beta have dominated since the market bottomed on April 8, 2025. The Jefferies graphic on the bottom illustrates how each subset has performed versus the overall benchmark (Russell 2000, or RUT), which is eye opening. As depicted, small cap active managers have struggled to keep pace during this junk rally.
Overseas, quality has been a meaningful laggard as well, with the Msci Eafe (EAFE) Quality Index underperforming the Msci Eafe by ~10% in both local FX and USD. According to Goldman Sachs, 2025’s top performing themes in Europe were Defense (+89.9%), Rate Sensitive Financials (+72.1%), and EU Miners (+55.5%). FMI considers most of the constituents in these buckets to be at the low-end of the quality spectrum and thus has limited exposure.
Big rally by lower-quality groups; really hurting active managers
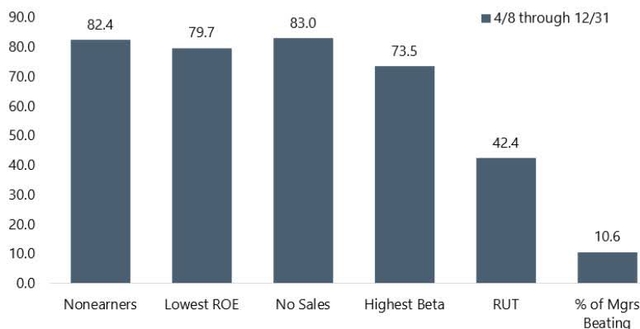
Source: FactSet; FTSE Russell; Lipper Analytical Services; Jefferies
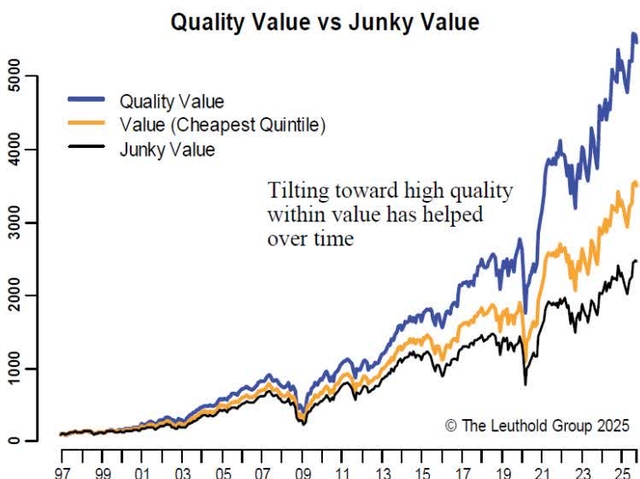
For those with a value orientation, as we deploy at FMI, a tilt toward quality has worked quite well over the long-term. The Leuthold Group tracks “Quality Value” (cheap stocks that also rank high on quality metrics) versus other gradients of value: “Value” (cheap stocks) and “Junky Value” (cheap stocks that rank low on quality metrics). Despite the recent headwinds, Quality Value’s long-term relative outperformance is unmistakable, as illustrated below.
So why does Quality Value work?
- Good businesses with sound balance sheets are better equipped to navigate difficult times.
- Earning a ROIC above cost of capital creates economic value; reinvesting at high incremental returns builds a powerful compounding effect.
- Investing in businesses with organic growth helps to avoid value traps (i.e. secular decline).
- Buying out-of-favor businesses at a discount to intrinsic value creates a margin of safety.
- Strong balance sheets allow for self-financing, avoiding expensive debt and equity issuance.
- Weak balance sheets can lead to insolvency or bankruptcy in distressed situations.
Given all of the above factors, Quality Value tends to offer superior downside protection during market downturns. Ultimately, buying advantaged businesses at discount valuations is a winning formula. Rallies like we are witnessing today are typically short-lived.
AI: Short Circuit?
The impact AI has had on global stock markets and economic growth is simply staggering. JPMorgan (JPM) has identified 42 AI-related stocks in the S&P 500, which today represent 45% of the index’s market cap. They estimate that these stocks have accounted for 78% of S&P 500 returns, 66% of earnings growth, and 71% of capital spending growth since ChatGPT launched in November 2022. Let that sink in…the narrow concentration over the last three years is astounding. Keeping up with the S&P 500 without leaning heavily into AI has been a virtual impossibility, per the table below. Excluding these 42 AI-related companies, the S&P 500 would have underperformed Europe, Japan, and China over the period.
Mega cap technology companies dominate the MSCI World Index as well, accounting for 9 of the top 10 holdings (all are U.S. companies). The High-Tech Strategist points out that “The U.S. accounts for just 4% of the world’s population and 24% of world GDP, yet these [top] 10 stocks account for 28.3% of the total MSCI World Index weighting. The total weighting of all U.S. stocks comes to 72.7% of the index. NVIDIA (NVDA) alone accounts for 6% of the index weight, more than all Japan’s stocks (5.5%). In country weights, Japan is second to the U.S.” This can be attributed to unwavering enthusiasm for just about anything that touches AI.
Returns, earnings and capex / R&D of AI-related stocks in the S&P 500 since ChatGPT launch in Q4 2022
Share of changes since November 2022
As it relates to the impact on the U.S. economy, JPM estimates tech sector capital spending contributed 40%-45% of U.S. GDP growth through the first 9 months of the year, up from less than 5% during the same period in 2023. As JPM depicts to the right, tech capex in 2025 dwarfs every major historical U.S. infrastructure project as a percentage of GDP. Well-known economist David Rosenberg pegs the AI impact on the economy as even greater, writing that “100% of the [1H25] GDP growth has come from the 8% chunk of the economy linked to the AI boom … the other 92% is completely flat.” This is consistent with the weakness we are seeing elsewhere in the economy (i.e., employment, housing, manufacturing, construction, transportation). There are clearly cracks beneath the surface, with underlying economic growth much less robust than it appears.
Asset-Heavy Firms Underperform
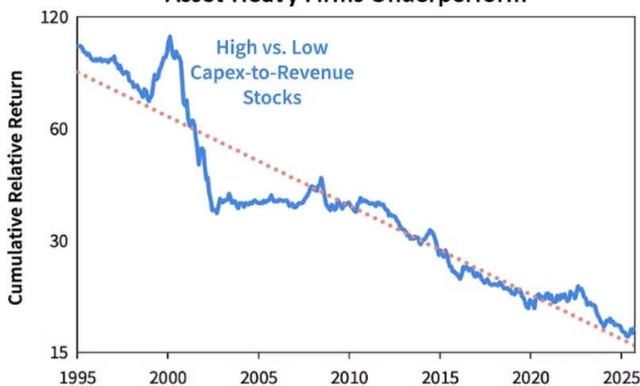
Source: S&P, Sparkline. Relative return of top vs. bottom quintile stocks based on trailing 1-year capex to revenue. Equally-weighted and rebalanced monthly. Universe consists of top U.S. stocks summing to 99% of total market cap. No transaction or financing costs. From 12/31/1994 to 9/30/2025.
As we wrote in our last letter, we see tremendous long-term potential for AI, but question whether the enormous amount of capital being spent will generate attractive returns and over what time frame. The numbers thrown around continue to mystify. OpenAI, for example, is looking to spend $1.4 trillion on AI infrastructure by 2033. The company, however, is only generating ~$20 billion in revenue, is unprofitable, burning cash, and completely dependent upon external financing. The math does not add up. OpenAI’s well-documented “circular” funding with its business partners (NVIDIA, Microsoft (MSFT), among others) is additional cause for concern.
Moreover, the top five hyperscalers are expected to spend over $500 billion on capex this year alone. The capital intensity of these businesses has sky-rocketed, with capex-to-revenue expected to reach 29% in aggregate in 2026. By way of comparison, well-known industrial company Caterpillar (CAT) has a historical capex-to-revenue of ~5%. One of the most capital-intensive industries in the world is railroads, where Union Pacific (UNP) has a comparable metric of around 14%. As illustrated below, capital intensity has not historically been well regarded by the stock market, with asset-light businesses increasingly outperforming over the last 30 years. Eventually, revenue will also need to follow. Bain Capital estimates AI companies will have to generate a whopping $2 trillion in combined revenue by 2030 to fund the computing power needed to meet expected demand, but are likely to fall short by around $800 billion. Something will have to give.
Tech capital spending in 2025 vs spending on major US infrastructure projects
Peak annual project percent of GDP
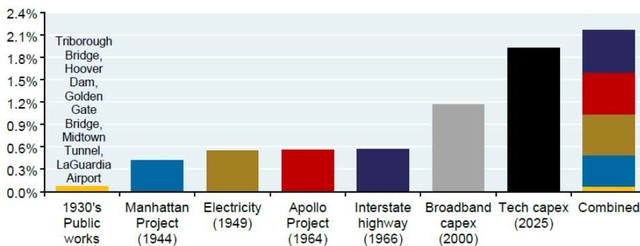
Source: Manhattan District History, BEA, Planetary Society, Eno Center for Transportation, San Francisco Fed, Hoover archives, Baruch, GoldenGate.org, New York Times, JPMAM, 2025
As we learned in the 2000 tech bubble, a ground-breaking technology (internet) can prove to be everything that was expected and more, but that may not be enough to mitigate the downside risks. Greenlight Capital’s David Einhorn opines, “Reflecting upon the internet bubble with the benefit of hindsight, whoever was the most bullish about the internet in the year 2000 was still not bullish enough. At the turn of the century, we had no smart phones, no tablets, no Wi-Fi, no Google, no Facebook, no TikTok, no cloud, and no video streaming. The internet has become much more important than even the biggest optimists believed.”
Importantly, that did not stop the Nasdaq index from falling 77% from its peak and 200 companies from going bankrupt.
If the AI stars do not carefully align, we could be in for a rough ride in the years ahead, with downside protection of paramount importance. In the meantime, we follow our DNA: buy strong companies that make money, avoid stressed balance sheets, stay disciplined on valuation, and keep it simple. While the market is less interested in our types of stories today, we view that as a historical anomaly. We will stay the course with confidence that better days lie ahead.
Despite the challenging backdrop, we continue to find attractive investment opportunities. The following are a few stock examples where we are currently finding value:
Hayward Holdings Inc. (HAYW) – Small Cap
Hayward Holdings is a leading global pool equipment manufacturer, primarily serving the residential pool market. North America accounts for 85% of sales and over 90% of profits. Product categories include Pumps, Automation and Sanitization, Heaters, Filters, Lighting and Water Features, and Cleaners. The company estimates that 80% of total sales come from their existing installed base of pools (50% repair and replacement), making the business relatively resilient to economic cycles. Hayward also exhibits strong pricing power as equipment purchase decisions are typically made by pool service professionals, who are less sensitive to price than the end customer. Pool service professionals also tend to be risk averse and primarily purchase equipment from the leading players in the industry. These dynamics lead to high margins and ROIC. The pool industry went through a period of supercharged growth in the early parts of Covid, which gave way to a period of extremely weak end-market demand, exacerbated by destocking in the distribution channel. The industry has since stabilized but is still experiencing lackluster demand for newly built and remodeled pools. We believe that over time, the discretionary sides of the business should recover. In the meantime, Hayward should be able to continue raising prices and growing volumes within the installed base of pools. They have a solid balance sheet, strong management team, and reasonable valuation multiple, particularly given their depressed earnings.
Accenture Plc Ci A (ACN) – Large Cap/All Cap/Global
Accenture is the world’s leading IT consultant, with advantages stemming from their depth and breadth across products, geographies, and industries. Their revenue is split roughly in half between IT consulting and managed services. Over the last four years, Accenture’s valuation has roughly halved. They’ve faced headwinds in IT spending and suffered from the perception that they are an AI loser. We believe that AI will cause deflationary pressure in parts of their business, but that it will be more than offset by the work required for enterprises to adopt AI. This is recently evidenced by partnerships with OpenAI and Anthropic. The AI supplier landscape is increasingly fragmented, and corporate customers need significant help adopting these technologies at scale. We believe this will drive AI suppliers and customers into Accenture’s arms. The current cyclical pressures are being attributed to structural issues, which we believe is incorrect, creating an attractive long-term set-up.
Smiths Group PLC (Smin Ln) (SMGZY) – International
Smiths is making tangible progress in its transition toward a more focused, higher-performing portfolio of industrial technology businesses. The Medical segment was divested in January 2022, with the exits of Interconnect and Detection expected to be complete in 2026. In parallel, management has simplified the operating structure and driven meaningful cost and capital efficiency improvements. The pro forma company (John Crane and Flex-Tek) is positioned for structurally higher growth, margins, and returns than the legacy conglomerate, underpinned by more concentrated exposure to flow-management and thermal-solutions markets, a high proportion of recurring revenue, and an active operational-excellence agenda. Their improved growth and profitability profile is complemented by a pristine balance sheet and substantial shareholder returns. While the shares have performed well recently, Smiths continues to trade at a modest valuation relative to its fundamental outlook and at a discount to its estimated break-up value.
Consistent with our succession plan, we are pleased to announce that Ben Karek has been elevated to Director of Research. Ben is an exceptional leader and has done an outstanding job during his 7+ years as a Research Analyst and a member of our Portfolio Management Committee (PMC). We are excited to see what Ben will achieve in his new role.
Thank you for your continued support of Fiduciary Management, Inc.
link


